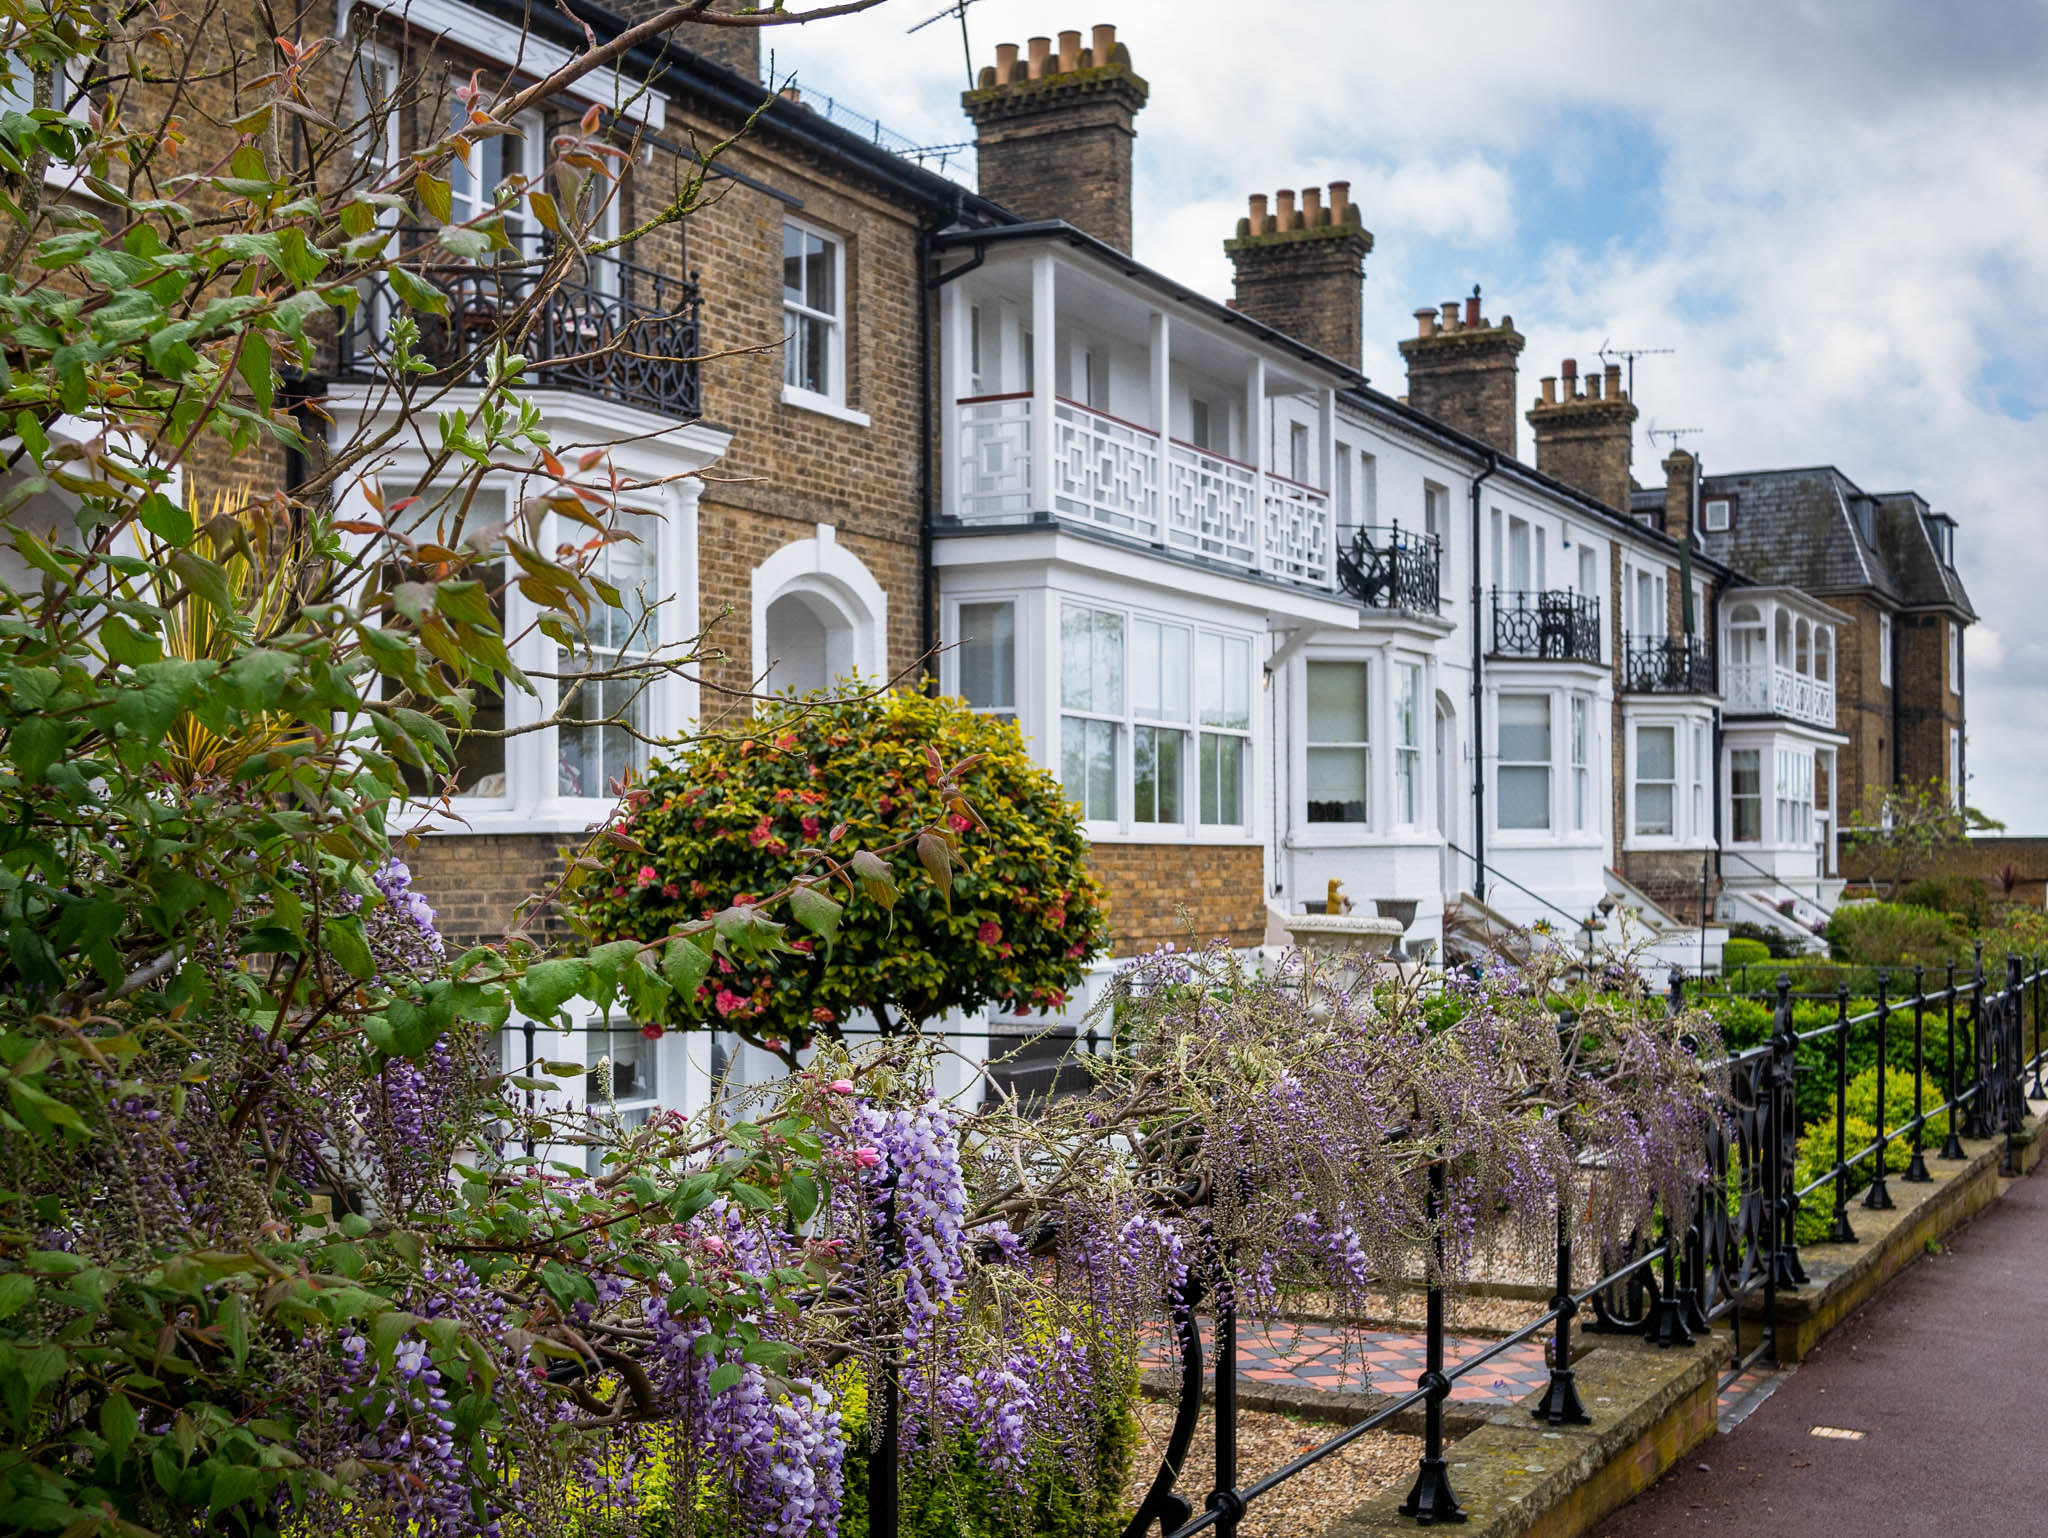

Southend-on-Sea, located on the South-Eastern coast of England in Essex, is a thriving seaside town known for its beautiful 7 miles of coastline and famous pier. Nearby neighbour Basildon is 10 miles west of Southend-on-Sea. Being situated only 26 miles East of Central London, is a great place to consider if you are looking for somewhere with an easy commute into the capital city. Both towns share the SS postcode district.
Over the decade from 2010 – 2019 a total of 81089 house sales went through in the SS postcode district.
This article aims to identify some of the key trends in house prices both in terms of house price brackets and also how transient each post code area is - in other words, which post code areas had the highest number of house sales during the period.
Southend-on-Sea & Basildon house price data by price bracket
Chart of Basildon & Southend-on-Sea house sales price data for years 2010-2019
In the first quarter of 2010 combined house sales totalled just 1270, which may be due to the after-effects of global financial crisis & a continued impact on the number of house sales.
The highest year of house sales was 2015 with a total of 9661 house sales; this was closely followed by 2014 with 9547.
At the start of the decade in 2010 the lower end of the property market the cheapest property went for less than £30,000, while the majority of the houses being sold were in the price bracket of £150,000 to £200,000 - a total of 1984 for 2010.
However, by the end of the decade in 2019 the number of house sales within this price bracket was only 217. The new most-popular price bracket had moved up to the £200,000 to £300,000 bracket with 2865 houses being sold in this price range during that year.
On the more expensive side of things, in Basildon & Southend-on-Sea, there were just 4 houses sold for over £1 million in 2010. Ten years later, this had risen sharply to 29 houses over £1 million being sold in 2019. This sharp increase means a more than 7 times increase in the number of house sales over £1 million in just 10 years.
Basildon & Southend-on-Sea house price data by postcode area
Chart of Basildon & Southend-on-Sea house price data by post code for years 2010-2019
In terms of the volume of house sales in a particular postcode district, the SS9 postcode district which represented the town of Leigh-on-Sea was overall the area with the highest number of house sales – a total of 9100 over the decade between 2010 and 2019. This amount represented around 10% of all the houses sold in the SS postcode area. This may have been due to the area growing in terms of size due to the new housing developments being built in the last 10 years.
The second highest postcode was SS7 which represents Benfleet with a total of 7867 house sales over the last decade, and the third highest being SS0 which was Westcliff-on-Sea with 7388.
Following those numbers were the Southend-on-Sea district of SS2 which came in fourth with a total of 5657 and SS8 which was Canvey Island with a total of 5258 making this the fifth most popular district within the area.
Real time Basildon & Southend-on-Sea house price information
If you are interested, you can see what the current selling prices for different types of houses & flats for sale in Southend-on-Sea & Basildon are here on the Propertyheads website, including 4 bedroom houses for sale, 1 bedroom flats for sale and also houses and flats to rent.
We also have a number of Southend-on-Sea estate agents who are available to chat through your property needs using our innovative messaging facility.
Added: May 15, 2020 10:59:00